|
Driving visitors to your site is about much more than just rankings. Branding is playing a larger and larger role in acquisition. In this article we look at the importance of branded searches and provide guidelines to help you understand, keyword by keyword, what you need to do to maximize your branded traffic. All you’ll need is Google Search Console and as many days of data as possible. Firstly let’s go over why this is important. It’s your company’s trafficBranded traffic is very rarely traffic you’d be happy to have leak through to another site. Aside from reviews and similar searches, you’d hope that 100% of branded searches land on your site. Unfortunately we see that this is not always the case. Between the floorboards of SEO and PPC there are cracks that rob you of valuable visits, sometimes deliberately, often by simple chance — regardless, we want to help you reclaim that lost traffic. In a recent talk at BrightonSEO, Rand Fishkin of SparkToro (and previously Moz) suggested that the future of SEO is in the SERPs and less “on the site.” While there is a growing trend in enhanced search results, data cards and featured snippets, there will always be an place at the table for digital (organic) brand reputation. Who cares about your brand’s reputation?This isn’t just about traffic or revenue. Your reputation can affect a number of crucial potential relationships both with individuals and other companies or institutions. Some of the more important potentially affected parties are listed below:
Branded vs non-branded trafficIf I were to offer you 100 new visitors that come via a branded search or 1000 who come via a generic non-branded search term, which would you chose? I suppose the answer will depend on a range of factors, one of which is your conversion rate. Regardless, it’s likely that exposure to the brand will have increased their likelihood to either convert or to investigate — and then convert! Understanding what percentage of your traffic is branded will help you to understand just how valuable this tool and article could be to your company. Measuring your brand / non-brand splitIn this (optional) section we’ll walk you through how to see your brand vs non-brand split without any need for paid tools or insane extrapolations of GA data. This is an optional step but will be relatively easy even for a “novice nerd” to follow. If you’d like to leapfrog this and don’t want insight into your branded traffic split, then skip ahead. 1. Start by ensuring you are logged in to a Google account with access to your Google Search Console (formerly Webmaster Tools). 2. Following this, visit https://datastudio.google.com in a separate tab and create a fresh blank report.
The phrase: “It’s so fine and yet so terrible to stand in front of a blank canvas” comes to mind! 3. Now, click in the bottom right of your screen to create a new data source.
4. Select the Google Search Console connector as shown below.
5. You may need to provide authorization to Google Data Studio.
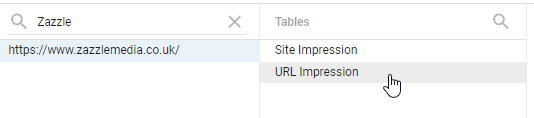
6. Now find your site in the list and select URL Impression and the ‘Connect’ button in the top right.
7. You should now be presented with a list of fields, however, we want to make a new one! Simply click the ‘add a field’ button. 8. The code you need can be seen below, you’ll need to replace the example brand with your own. The expression we have used will look for any search term containing either “zaz” or “le me” to determine whether the keywords are branded or not, keep this simple and short. CASE WHEN REGEXP_MATCH(Query, (“.*zaz.*|.*le me.*”) ) THEN “Branded” ELSE “Non-Branded” END You can add more between the speech marks with a |.*text here.* expression. 9. Give the field a name (such as ‘Branded Split’), save it, and we’re almost there! 10. You may still need to add the data source to the blank template, select it from the list to the right and click “Add to Report”
11. Your report will change into a grid and you can now make your chart show brand vs non-brand. 12. Select the type of graph you want to use (I favor area graphs personally) and draw an appropriately sized rectangle. When the graph is selected you’ll need to adjust the ‘Data’ menu to show: Time Dimension: Date Breakdown Dimension: Branded Split (or whatever you called your field) Metric: URL Clicks 13. You can adjust how the chart displays in the ‘Style’ menu, below is my example where I have disabled stacking to show separate lines.
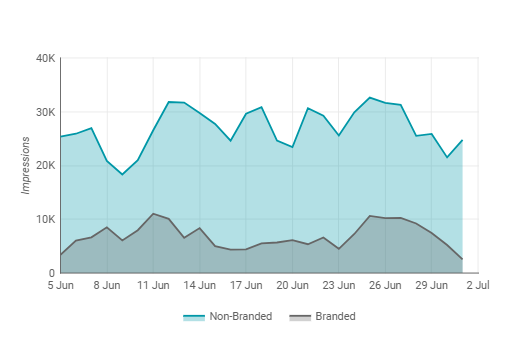
14. Changing your metric to ‘Impressions’ can allow you to quickly see the difference between the two, it often helps to highlight where you may rank for a huge keyword that is unrelated such as a celebrity or a similarly named brand.
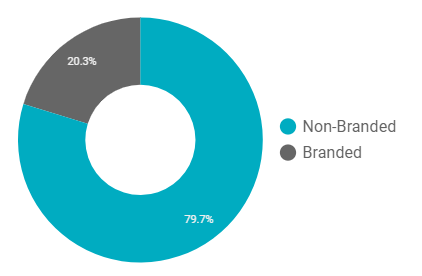
15. While this information is useful you may find it difficult to understand how the data averages out – as such, a pie chart may provide you with a clearer ratio. Naturally, a high ratio of branded search increases the importance of this article and our associated tool.
16. You can use data studio to list the keywords making up these impressions/clicks etc, but for the purpose of this investigation we’ll just be using Google Search Console directly from now on. If you’ve enjoyed this dabble into Data Studio, let us know in the comments and we’ll be sure to produce more insightful posts using it. Keywords to ProtectWhen looking for the keywords you want to assess, ensure you consider the below aspects of your company.
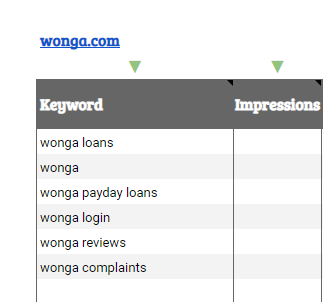
Tool and training for brand reputation1. Zazzle Media offers a free [gated] Google Sheet available here for brand reputation protection. 2. Make a copy of this sheet on your own Google account or the shared business account you have for all things ‘web’. 3. Name the sheet to whatever you like. 4. In the Dashboard tab – Cell B3, pop your root domain such as zazzlemedia.co.uk or wonga.com. 5. The only other input on the Dashboard tab is for you to list your keywords between B6 – B27. 6. You can find these quite easily by nipping into GSC and filtering by your brand. Alternatively you can do this with your Bing WMT account, however the important keywords will likely be the same regardless of search engine.
7. Add both the appropriate brand keywords and the associated impressions to the table. We’ve used Wonga in our example data.
8. Your impressions won’t be weighted but it can help you identify high impression (high importance) keywords that have low scores. 9. Now that you’ve entered your keywords into the Dashboard you can move to the Scoring tab. 10. You’ll notice there are 10 positions for each keyword, to mirror the results page in either Google or Bing – depending on where you are running your investigation. Simply enter the full URL of the pages into the Full URL column.
11. The domain column will fill out automatically. If you’ve accidentally removed the formula just enter the below code into cell E6 and drag down <wrap the below in code tags> 12. Similar to the domain column, the Title column will also fill out automatically. Again if you’ve removed the formula, enter the below code into cell F6 and drag down too (and stop deleting the formulas!) <wrap the below in code tags> 13. The titles should automatically fill out due to the importXML feature, however it’s not always 100% perfect, you may need to manually enter a title. The titles are only used to help you judge the impact any article might have and naturally relies on competitors/sites having appropriate titles. 14. Lastly you’ll need to score the URLs from -10 to 10 the table below suggests how you should score, but always take into account where the page is ranking too, a slightly negative article in position 3 is potentially worse than a competitor in position 9.
15. We’ve filled the sheet in with the company Wonga.com who recently closed their doors and are no longer offering new loans. This combined with the cannibalistic nature of lenders meant that we were guaranteed a vibrant set of results. 16. Once you have scored every URL you can move back to the Dashboard tab. 17. You’ll find automated lists of both the positive and negative sites, there is a good chance your site will be the only positive but this depends heavily on the media’s representation of your brand. 18. The original tab where you entered your keywords will also now have scores for your site. You’ll find an overall average, an external site score and a score specifically for pages that your site has featured in the SERPs. In the example we’ve produced there is (or was!) a clear need for Wonga to own their reviews more and improve their targeting of “wonga login”. 19. Below the automated graphs and keyword table you’ll also find a simple score for Offence, Neutral Game and Defence.
20. Individual keyword scores are certainly more actionable however the overall scoring provides you with a good benchmark for brand protection KPIs. Hopefully you’ve been able to gain some interesting insight into your brands perception within branded search results and, if needed been able to make use of the training recommendations made within our tool. Improving Organic Brand ReputationWe’ve provided a ‘Training’ tab that suggests some of the basic but nevertheless critical points around brand protection. Following these is a great starting point, however if you have additional resource beyond managing these factors consider doing a similar exercise with a copy of the sheet for your competitor’s terms – put yourself in their shoes and discover how they are doing certain elements better than you. To hark back to the example we showed earlier for Wonga, one of their primary competitors was QuickQuid who just have a simple page to target this term:
It’s better than nothing, and is a good step towards trying to outrank the Trustpilot page that might be a darn sight more damaging.
If you need additional support or help with managing your digital reputation – get in touch! And be sure to get the tool to help you with managing your brand reputation in the SERPs. I hope you’ve found the tool and associated insight to be useful. Please let me know how you get on @StuartShawUK. from https://searchenginewatch.com/2018/11/08/organic-reputation-management-brand-protection/
0 Comments
Leave a Reply. |

AuthorPleasure to introduce my self i am Sean Webb i am 27 years old from Manchester, UK.I am doing affiliate marketing and have spend lots of time learning how to rank easy to medium competition keywords. I have recently started PPL and Video Marketing and learning more about it. ArchivesNo Archives Categories |


 RSS Feed
